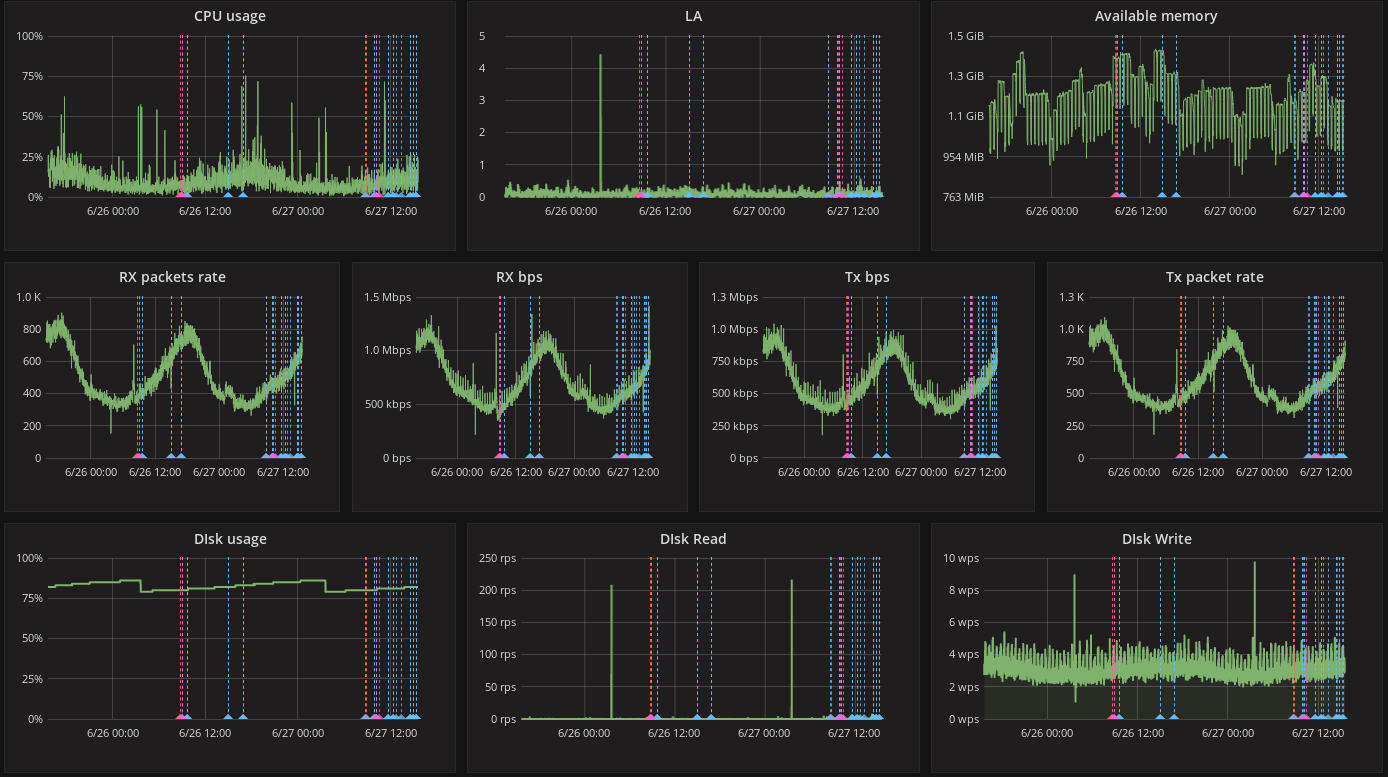
2020-10 upd: we reached the first fundraising goal and rented a server in Hetzner for development! Thank you for donating !
CBSD, Grafana, and Prometheus
Statistics about the jails and containers used in a virtual environment, the components being used and the resources being consumed over time, are used to monitor the health and wellbeing of the virtual environment. CBSD uses FreeBSD jail(8)'s and bhyve(8) virtual machines. This article will explain how to generate statistics using Prometheus, and then generate graphs of this data using Grafana.
To generate useful, interesting statistics, the main metrics used are;- CPU usage;
- Memory usage;
- Storage I/O bandwitch;
- Storage IOPS;
- Traffic bandwitch;
Information from each metric can be obtained multiple ways in FreeBSD. For example, CPU usage can be obtained from bhyve, using the rctl(4) framework, or by using tools like top(1) and ps(1), or kvm_getprocs(3) (in no particular order). I/O information can be obtained via GEOM or 'zfs iostat', vmstat(8), or iostat(8). Traffic usage and bandwith information can be obtined from netstat(1) or via ipfw(8) counters, or by using pf(4).
The scripts provided by CBSD allows the gathering of
useful metrics data, then provides an interface for further processing.
For example, to view information about the flow of traffic in CBSD for a particular
jail use trafstat.
This article will describe how metrics can be exported, then presented in a
visually pleasing graphical way.
Starting with version 11.1.0, CBSD allows metrics to be exported
from the
jrctl and
trafstat
utilities into a unified format for both jail and bhyve using the Prometheus format.
Prometheus Configuration
The following components will be used;
- FreeBSD is the underlying OS, which allows the magic to happen.
- The target bhyve and jail (hypervisor and container respectively) from which services are run, and metrics are gathered from.
- CBSD - the bhyve and jail management framework, which also allows statistics gathering on a hypervisor or container in the prometheus format;
- Prometheus - Is a system for collecting metrics in the format of key-value pairs with the ability to sample with requests, using an efficient data-storage engine (leveldb). Prometheus is integrated with Grafana, and also has client libraries for many popular programming languages.
- Grafana - Is a popular and flexible system of Dashboards with analytics and graphs based on any metrics provided.
To get information about a virtual machine or container by their name in CBSD, the command 'cbsd jrctl' can be used. This script uses the metrics provided by the RACCT framework. In order to use RACCT, it must be enabled in /boot/loader.conf.
# echo "kern.racct.enable=1" >> /boot/loader.conf
By default, 'cbsd jrctl' shows information in the key-value format:
# cbsd jrctl mode=show jname=f11
datasize=2080K
stacksize=264K
coredumpsize=0
memoryuse=63M
memorylocked=0
maxproc=1
openfiles=40
vmemoryuse=1099M
nthr=29
nsemop=0
wallclock=6206
pcpu=0
readbps=0
writebps=0
readiops=0
writeiops=0
If the jname= argument is omitted, information on all available environments will be displayed. If this command is called with the prometheus=1 key, the output will be in the format that is expected for prometheus targets.
As described above, there are different ways to export metrics in the prometheus format. One way is to send the desired metrics directly to prometheus using any programming language that has a prometheus client library.
Another option is to allow the prometheus server itself to collect the necessary statistics. To implement this option, a simple daemon can be written to proxy the output of the command 'cbsd jrctl mode=show prometheus=1' on specific tcp ports. To avoid potential security issues, the daemon should be secured from the actions of possible intruders as working with the command 'cbsd' requires a privileged user. To help mitigate this potential security issue, the output of 'cbsd jrctl' could be redirected into an intermediate file that can then be served through any web server, for example NGINX.
Schematically, this setup might look like this:
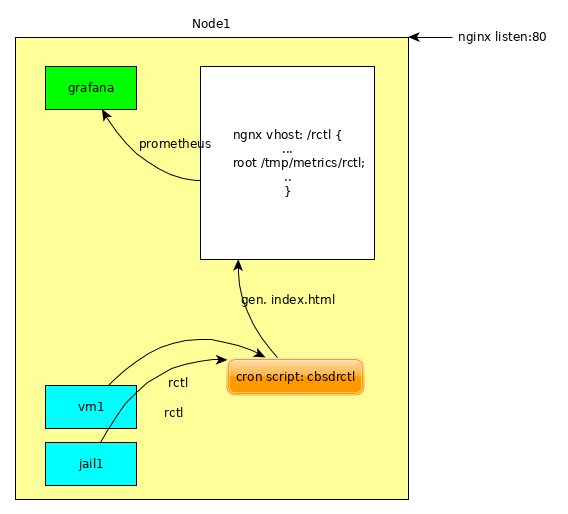
The collector and generator of the index.html file can act as a self-written daemon, or be a script called from cron, as a demonized sh-scripts, which will be described here.
Each node will export its metrics via http://<FQDN>/rctl/, then prometheus job collects statistics, then passes the statistics to grafana.
Prometheus and Grafana are installed in the jail that is specified in the dialog to create a new container.
For "jname", any arbitrary name can be used, for example: grafana
# cbsd jconstruct-tui
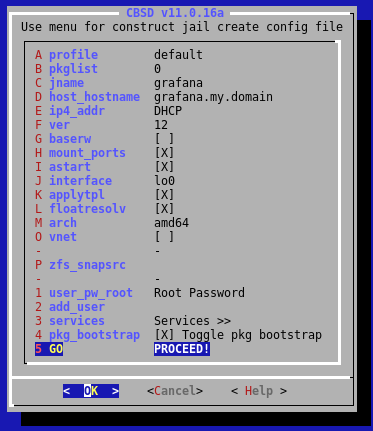
The remaining parameters can be changed depending on the requirements of the jail being created, then choose 'GO PROCEED!'
Now install the prometheus and grafana packages into the newly created jail;
# cbsd jstart grafana
# cbsd jlogin grafana
# pkg install -y net-mgmt/prometheus www/grafana4
Enable the services to run on startup;
# sysrc grafana_enable="YES"
# sysrc prometheus_enable="YES"
Edit the configuration file /usr/local/etc/prometheus.yml;
global:
  scrape_interval:     15s
  evaluation_interval: 15s

  external_labels:
      monitor: 'codelab-monitor'

rule_files:

scrape_configs:
  - job_name: rctl
    metrics_path: /rctl/
    static_configs:
      - targets: ['rctl.olevole.ru:80']
This configures prometheus to send the statistics gathered to the following locations;
- rctl.olevole.ru:80 - Send the statistics directly to the configured host's FQDN and nginx port. (configuration below)
- scrape_interval: 15s - The interval that prometheus will query the configured metrics. In this case, the frequency of every 15 seconds is set.
Start the required services;
# service grafana start
# service prometheus start
Now the jails can be started, and services configured.
If a user account does not have access to the container directly, the following commands can be run on the host to forward required ports;
# cbsd expose mode=add in=3000 jname=grafana
# cbsd expose mode=add in=9090 jname=grafana
Next, a script is needed that will be run when the server starts. The script needs to be able to regenrate the index.html file based on the interval configured earlier in prometheus. (15 seconds) The index.html file contains the metrics based on the output of the command 'cbsd jrctl'.
Here is an example cbsdrctl script to create the index.html;
#!/bin/sh
while getopts "r:i:" opt; do
        case "$opt" in
                r) root_dir="${OPTARG}" ;;
                i) interval="${OPTARG}" ;;
        esac
        shift $(($OPTIND - 1))
done

export TMPDIR="${root_dir}"
unset jname

if [ -z "${root_dir}" ]; then
        echo "Empty root_dir, please use $0 -r path"
        exit 1
fi

[ -z "${interval}" ] && interval="15"
[ ! -d "${root_dir}" ] && mkdir -p ${root_dir}

while [ true ]; do
        INDEX_OLD=$( readlink ${root_dir}/index.html )
        INDEX_TMP=$( mktemp )

        trap "/bin/rm -f ${INDEX_TMP}" HUP INT ABRT BUS TERM EXIT

        chmod 0644 ${INDEX_TMP}

        truncate -s0 ${INDEX_TMP}
        /usr/bin/lockf -s -t0 /tmp/cbsd-rctl.lock /usr/local/bin/cbsd jrctl mode=show prometheus=1 > ${INDEX_TMP}

        ln -sf ${INDEX_TMP} ${root_dir}/index.html
        rm -f ${INDEX_OLD}
        sleep ${interval}
done
cbsdrctl takes two parameters, or arguments, -r and -i. The -r parameter is to specify the root directory to write the index.html file. The -i argument is to specify the interval to refresh the statistics in index.html.
Looking at cbsdrctrl, the script enters an infinite loop that sleeps for the specified interval, then runs again, writing an updated copy of index.html. This allows for the continous update of the data needed to generate the desired statistics.
Save the script as cbsdrctl in the /root/bin directory, then make the script executable by setting the executable flags;
# chmod +x /root/bin/cbsdrctl
cbsdrctl can generate the index.html file, but only if the script is started. This is handled by creating an rc.d-script to conveniently start cbsdrctl when the system boots up, and stop the script during system shutdown.
Here is an example rc.d-script cbsdrctl-rc.d);
#!/bin/sh
#
# PROVIDE: cbsdrctl
# REQUIRE: LOGIN FILESYSTEMS sshd
# KEYWORD: shutdown
#
# cbsd_rctl_enable="YES"
#

. /etc/rc.subr

name=cbsdrctl
rcvar=cbsdrctl_enable
load_rc_config $name

start_cmd=${name}_start
stop_cmd=${name}_stop
status_cmd="${name}_status"
restart_cmd=${name}_restart
extra_commands="restart"

# Set defaults
: ${cbsdrctl_enable:="NO"}
: ${cbsdrctl_interval:="15"}
: ${cbsdrctl_root:="/tmp/metrics/rctl"}

cbsdrctl_start()
{
        if [ -r ${pidfile} ]; then
                echo "Already running: `cat ${pidfile}`"
                exit 0
        fi
        /usr/sbin/daemon -f -p ${pidfile} /root/bin/cbsdrctl -r ${cbsdrctl_root} -i ${cbsdrctl_interval}
        echo "STARTED: -r ${cbsdrctl_root} -i ${cbsdrctl_interval}"
}

cbsdrctl_status()
{
        if [ -f "${pidfile}" ]; then
                pids=$( pgrep -F ${pidfile} 2>&1 )
                _err=$?
                if [ ${_err} -eq  0 ]; then
                        echo "Running"
                else
                        echo "Not running"
                fi
        else
                echo "Not running"
        fi
}

cbsdrctl_restart()
{
        cbsdrctl_stop
        cbsdrctl_start
}

cbsdrctl_stop()
{
        if [ -f "${pidfile}" ]; then
                pids=$( pgrep -F ${pidfile} 2>&1 )
                _err=$?
                if [ ${_err} -eq  0 ]; then
                        kill -9 ${pids} && /bin/rm -f ${pidfile}
                else
                        echo "pgrep: ${pids}"
                        return ${_err}
                fi
        fi
}

pidfile=/var/run/$name.pid
run_rc_command "$1"
Save this script as /usr/local/etc/rc.d/cbsdrctl and set the executable flags;
# chown root:wheel /usr/local/etc/rc.d/cbsdrctl
# chmod 0555 /usr/local/etc/rc.d/cbsdrctl
Looking at the init script, the interval to generate stats, and the working directory parameters have been moved into the following variables:
cbsdrctl_interval (default value: 15)
cbsdrctl_root (default value: /tmp/metrics/rctl)
Making the parameters variables that get set in the init scrip allows the values to be easily changed based on system requirements. The default values can be redefined in rc.conf;
# sysrc cbsdrctl_interval="15"
# sysrc cbsdrctl_root="/tmp/metrics/rctl"
Install the script as an init script;
# sysrc cbsdrctl_enable="YES"
cbsdctrl will now be started everytime the system boots. The script can also be stopped or started manually.
Start the script;
# service cbsdrctl start
Stop the script;
# service cbsdrctl stop
NGINX Configuration
If everything up to now has gone according to plan, the directory /tmp/metrics/rctl will start updating the symbolic link index.html to point to the current file containing the desired metrics
The index.html file containing the stats doesn't do much without a web server to display the stats being generated.
Install nginx pkg, then enable it to start on boot;
# pkg install -y nginx
# sysrc nginx_enable=YES
Open the NGINX configuration file /usr/local/etc/nginx/nginx.conf. A description of the virtual host is required for NGINX to properly serve the index.html file that is now being generated.
The following virtul host example uses the FQDN rctl.olevole.ru. The server_name directive should reflect the actual FQDN of the server NGINX is running on.
server {
        listen       80;
        listen      [::]:80;
        server_name  rctl.olevole.ru;

        location /rctl {
                root /tmp/metrics;
        }
}
Now start NGINX:
# service nginx start
As long as everything is running, and properly configured, pointing a browser to http://<FQDN>/rctl should show the contents of the file /tmp/metrics/rctl/index.html
Check the Work
Prometheus provides a way to verify that the metrics are being gathered correctly via port 9090 on the host the prometheus process is running on. Open a web browser, and go to 127.0.0.1:9090 to open the Prometheus server.
The dropdown list next to the Execute button lists all of the metrics that
CBSD is able to provide.
If the metric refers to a container, the metric will start with
the prefix jail_.
Parameters for virtual machines contain the prefix bhyve_.
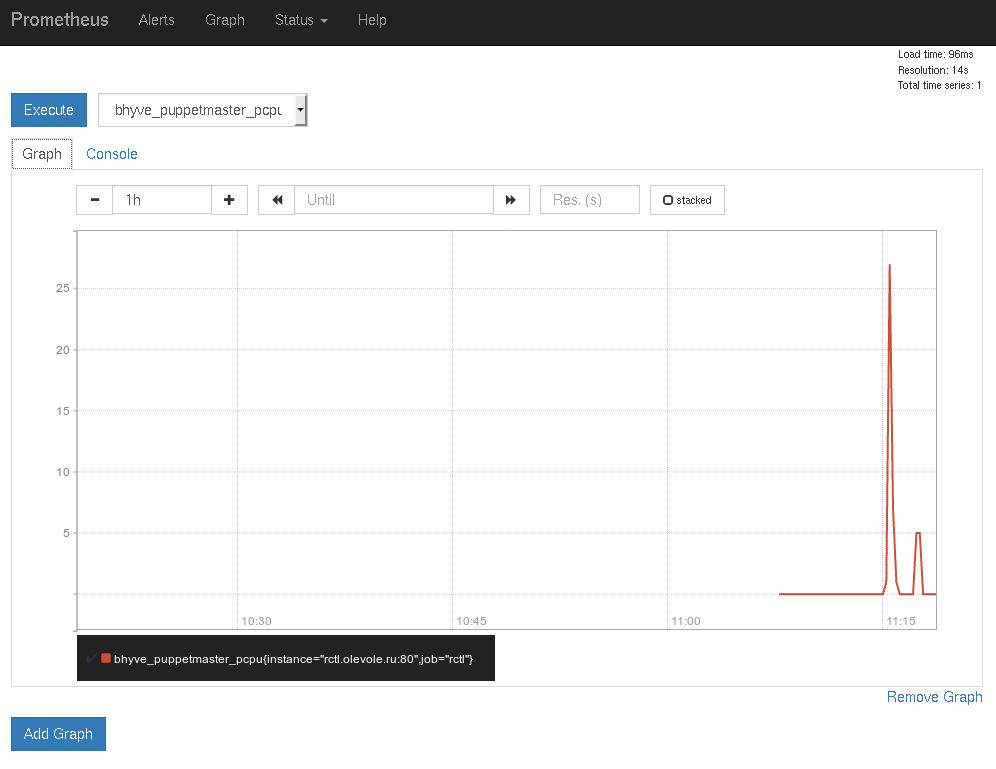
Now that the statistics are being generated, a custom Dashboard for the virtual environments can be created using Grafana.
GRAFANA
To work with Grafana, open a browser and go to http://localhost:3000 on the server where the Grafana process is running. Grafana uses admin for both the username, and password by default. Make sure to change the default password as soon as possible.

After logging in, the first screen presents configuration options. Users can be added, data sources configured, and the ability to add additional plug-ins.
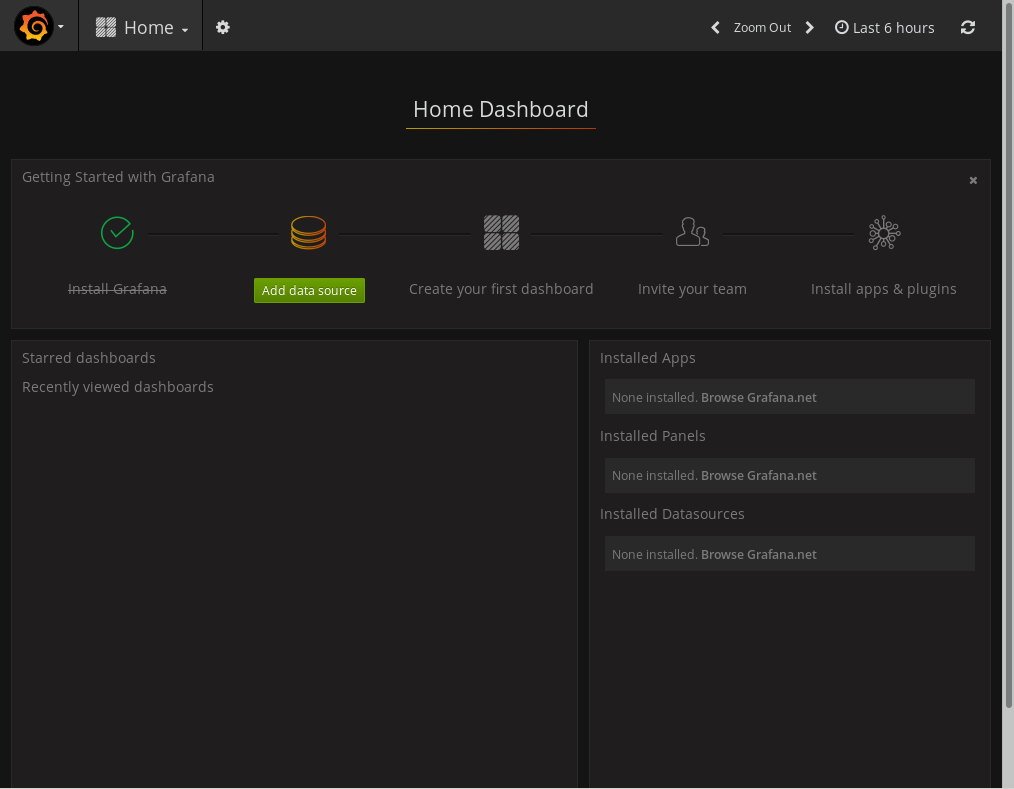
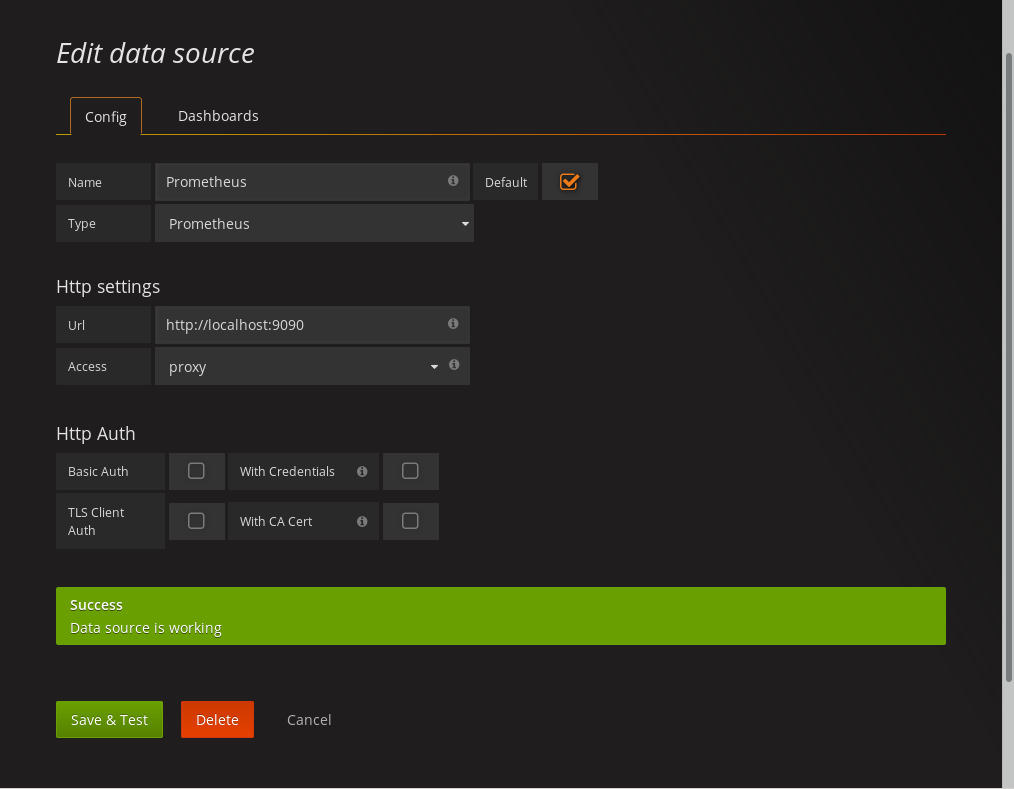
Prometheus is generating the data for Grafana to use. Click the Add data source button to configure prometheus as the data source. In this example, since prometheus operates from the same environment as Grafana, the url value can be set as http://localhost:9090. Click the Save&Test button to create the first graph.
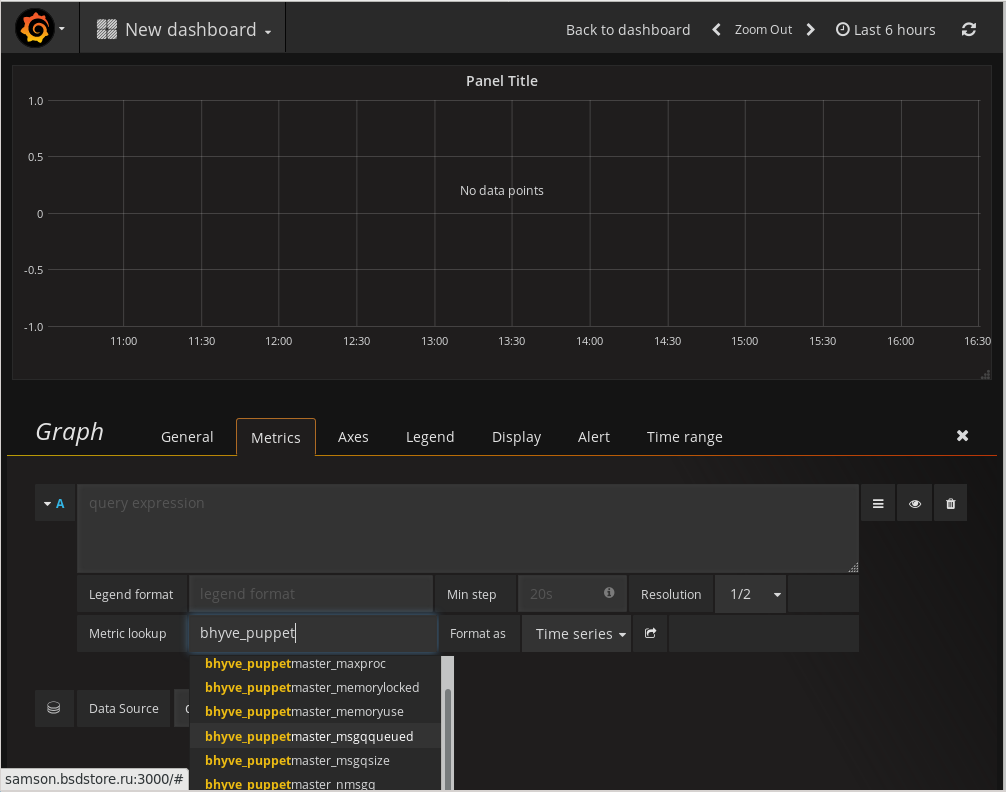
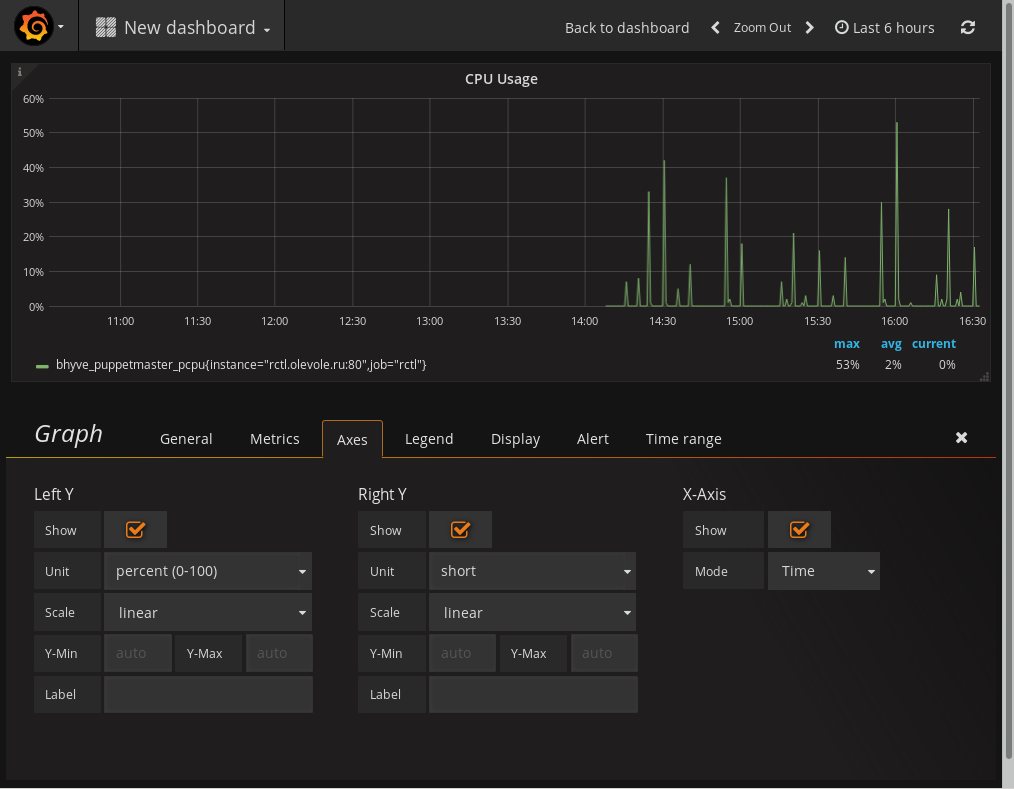
To add an individual metric, start typing in the Metric lookup field. The field has autocompletion, which makes it easy to find a desired parameter
Final Thoughts
Hopefully this article shows how easy it is to export the available metrics for both jails and bhyve. New servers added will automagically be added into the metric database. Previously configured scripts do not need to be modified. The examples used in this article obtained metrics from the FreeBSD RACCT framework using the data available using the /rctl path in the URL. CBSD is not limited to using only RACCT metrics. Additional metrics can be created, for example traffic metrics or billing data, which can then be accessed using the respective path. /traffic or /billing ect. These metrics can then be exported to grafana. Metrics can be increased and expanded. For example, using /trafstat, metrics for the traffic of containers can be gathered and then displayed. For /billing, metrics can be adjusted with a schedule of taxes/tariffs and costs associated with the resources that have been consumed. Configuration, and the statistics that can be displayed is only limited by the imagination of the administrator doing the configuration. Information about the status of monitored systems allows an adminstrator to easily identify possible trends, be it the need for more resources, or to identify potential issues before they become emergencies. Finally, FreeBSD and CBSD make obtaining, and configuring useful information easy, and displaying this information as easy as clicking a button.
